One of the most important decisions portfolio managers make is where the resources of the organization should be focused. There are tons of prioritization techniques to determine which project, epic, or feature should be the first to implement.
To make the best use of a prioritization method or technique, you should know how it works, what are its limitations and preconditions. In this post, I will show you three little “catches” of Cost of Delay (CoD) based prioritization methods, such as WSJF.
Understanding the role of Job Size
WSJF score formula includes job value and size, which may remind you of the ROI calculation. Compare:

and:

Both formulas include benefits (value) and costs (job size). However, the job size factor in the WSJF stands for an entirely different reason. The real intention of the score is to weigh the cost of delay against the lead time. Because the lead time is something that can vary depending on the situation (e.g., resource availability), the job size is the best substitute for lead time.
SJF will not indicate whether it makes sense to do the projects, and it will not replace your project selection process. The value of the score is in comparing it with the score of other jobs, rather than making any conclusions from its absolute value. This means you will have to pre-select the jobs using other methods before you apply WSJF prioritization.
Do not underestimate the time criticality factor
Many articles explain the cost of delay based prioritization using trivialized examples of calculating the cost of delay. While it will illustrate the principle, it is not enough to apply it in real life.
Typically, in such examples, you see how the cost of delay remains constant over time and prioritization becomes painfully easy. There are many situations where the cost of delay is close to a constant. For example, in a factory that produces 100,000 parts per week, a certain improvement project would lead to cost reduction of $1 per each part. Here, the cost of delay will be $100k / week.
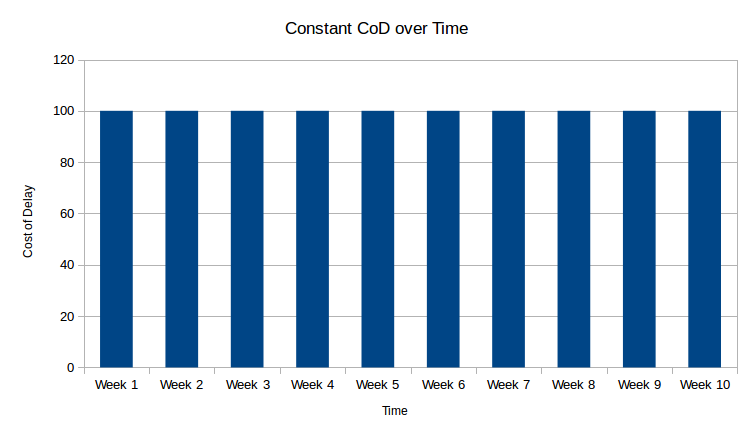
If another project would lead to cost reduction of $0.8 per part, it would be obvious to figure out the priority between these two.
You will likely encounter more interesting situations than the constant CoD. Below are common examples.
Situation 1: Opportunity diminishes over time
Several competing high-technology companies A, B, and C are working on CPU chips for laptops. All three will release their next generation chips this year. Company B is planning to release in August, and Company C is releasing in November. You work for Company A, and depending on the project priority, you can release somewhere from May to December.
The cost of delay in this case may look like this:
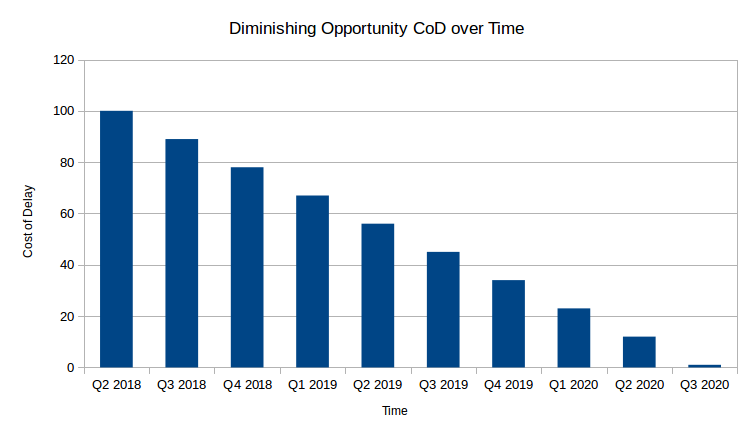
Releasing in May will bring the most revenue because of more sales and more pricing power due to being the first to market. Revenue diminishes over time as competitors bring their products to market. With time, revenue decreases even further as the technology gets outdated, until there is no revenue to be made.
Likely, your function will not be as linear as shown on the graph. In the example above, the graph should react to the release dates of the competitors, creating valleys in the CoD.
Situation 2: Delay only matters after a certain moment
You are working on a large program to launch a space exploration mission to Jupiter. One project to prioritize is a project to design and manufacture a rocket engine. Suppose the mission is launching in 2022, and due to dependencies, the earliest time the engine will be used is 2020.
Here, the cost of delay before 2020 is zero, increasing after 2020, as delays to other projects are introduced.
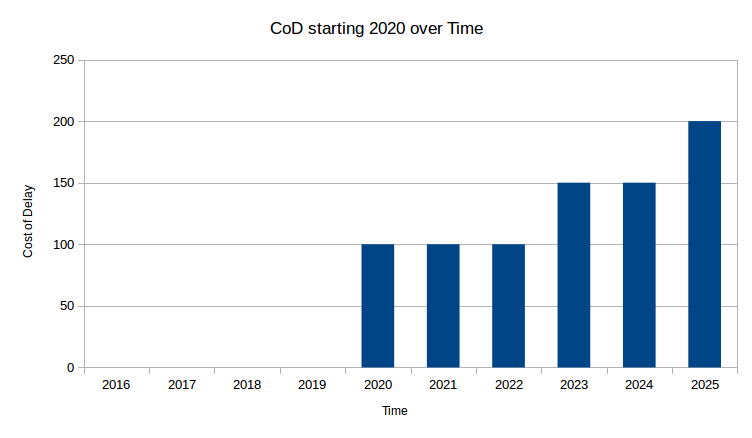
As the delay is longer, more projects are affected, leading to further growth of the cost of delay.
Situation 3: One-time opportunity
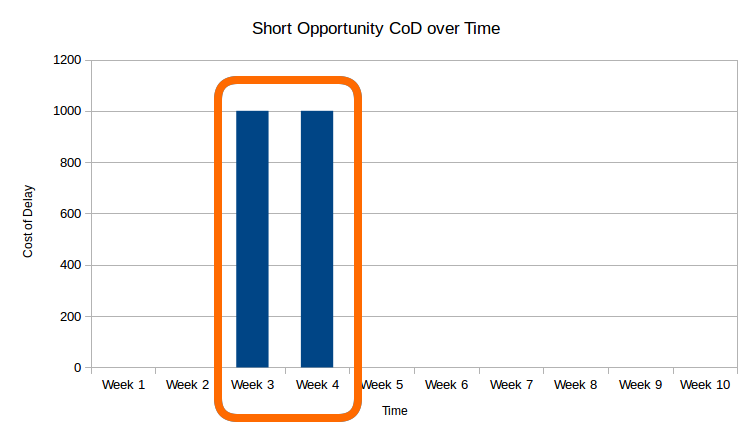
Your organization has been shortlisted to be the catering provider for a large conference, which will take place in your city in five weeks. The project to prepare, organize, and provide the catering will only bring value if done on time. There is no value in launching the project earlier, as there is equally no value in launching it later.
The cost of delay may look like this:
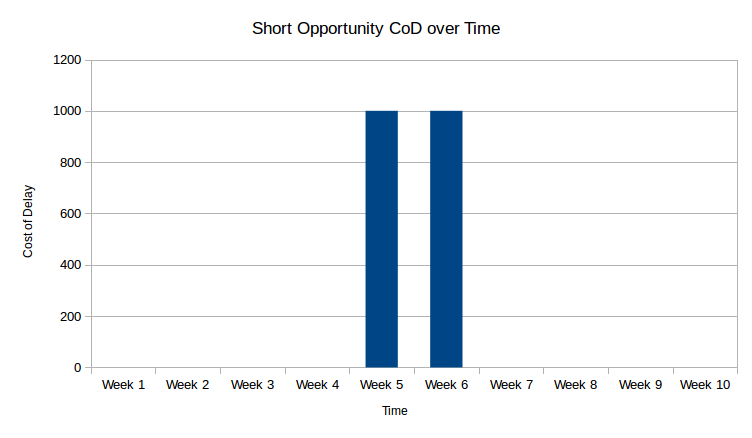
Planning projects where the opportunity lifespan is short will require better project management – particularly, risk management – to ensure delivery on time.
How to work with the time criticality factor in WSJF
Let’s see how we can deal with two projects – S1 (representing the Situation 1 above) and S3 (representing the Situation 3).
Suppose the lead time to execute S1 is 4 weeks and lead time to execute S3 is 2 weeks. Both projects will take all available resources and cannot be run parallel.
Cost of Delay for S1:

and like this for S3:
Alternative 1: S1 first, S3 second
Here, the “green rectangle” on the first graph will be captured, while the “orange rectangle” on the second graph will be lost.
Gained opportunity ~100, lost opportunity about ~2000.
Alternative 2: S3 first, S1 second
Here, we will deliver S3 on time, but will lose some of the diminishing opportunity on S1.
Gained opportunity ~2000, lost opportunity ~100.
Usually, you do not have to add the time criticality factor to the value and risk/opportunity score, despite what the formula says. Rather, you want to consider it when generating options. Depending on how complex your prioritization is, consider advanced tools, such as Monte Carlo simulation.
Do not underestimate the risk factor
Another component of the WSJF model is the risk reduction / opportunity enablement value factor.
Ignoring or underplaying the risk / opportunity factor can have a devastating impact on your portfolio.
Here are simple things you could do to quantify the risk:
- If you are dealing with many risks of the same order of magnitude, you can use a simple EMV calculation.
- If you are dealing with a large risk, you can assign it a cost of full insurance or implement an alternative to work around the risk.
- For unacceptable risks, you can use an artificially defined value high enough to take priority.
Try, tune, try again
As with any other prioritization method, there are a lot of nuances in applying WSJF to your portfolio. Organizations have differences in culture towards risk tolerance, different situations with resources, different types of projects, and so on.
The method will require tuning when applied in your context. So, experiment to find what works best for you and your company.
Title photo by chuttersnap on Unsplash
